Showing posts with label cartography. Show all posts

Friday, April 9, 2021

Mapping the Laramie Plains II: 3rd dimension captured

Two views of Sheep Mountain[s]: 1895 USGS map and 2011 photo looking northwest from Sodergreen Lake.

To refresh your memory, and for you who missed Mapping the Laramie Plains I: in pursuit of the 3rd dimension, this story began with the promise of a map of the Laramie area on which "almost every hill and cañon [sic] can be determined at a glance!" according to the Laramie Boomerang in 1893. Yet the post ended before we could share in the reporter's excitement. That's because the back story was so long—three millennia.

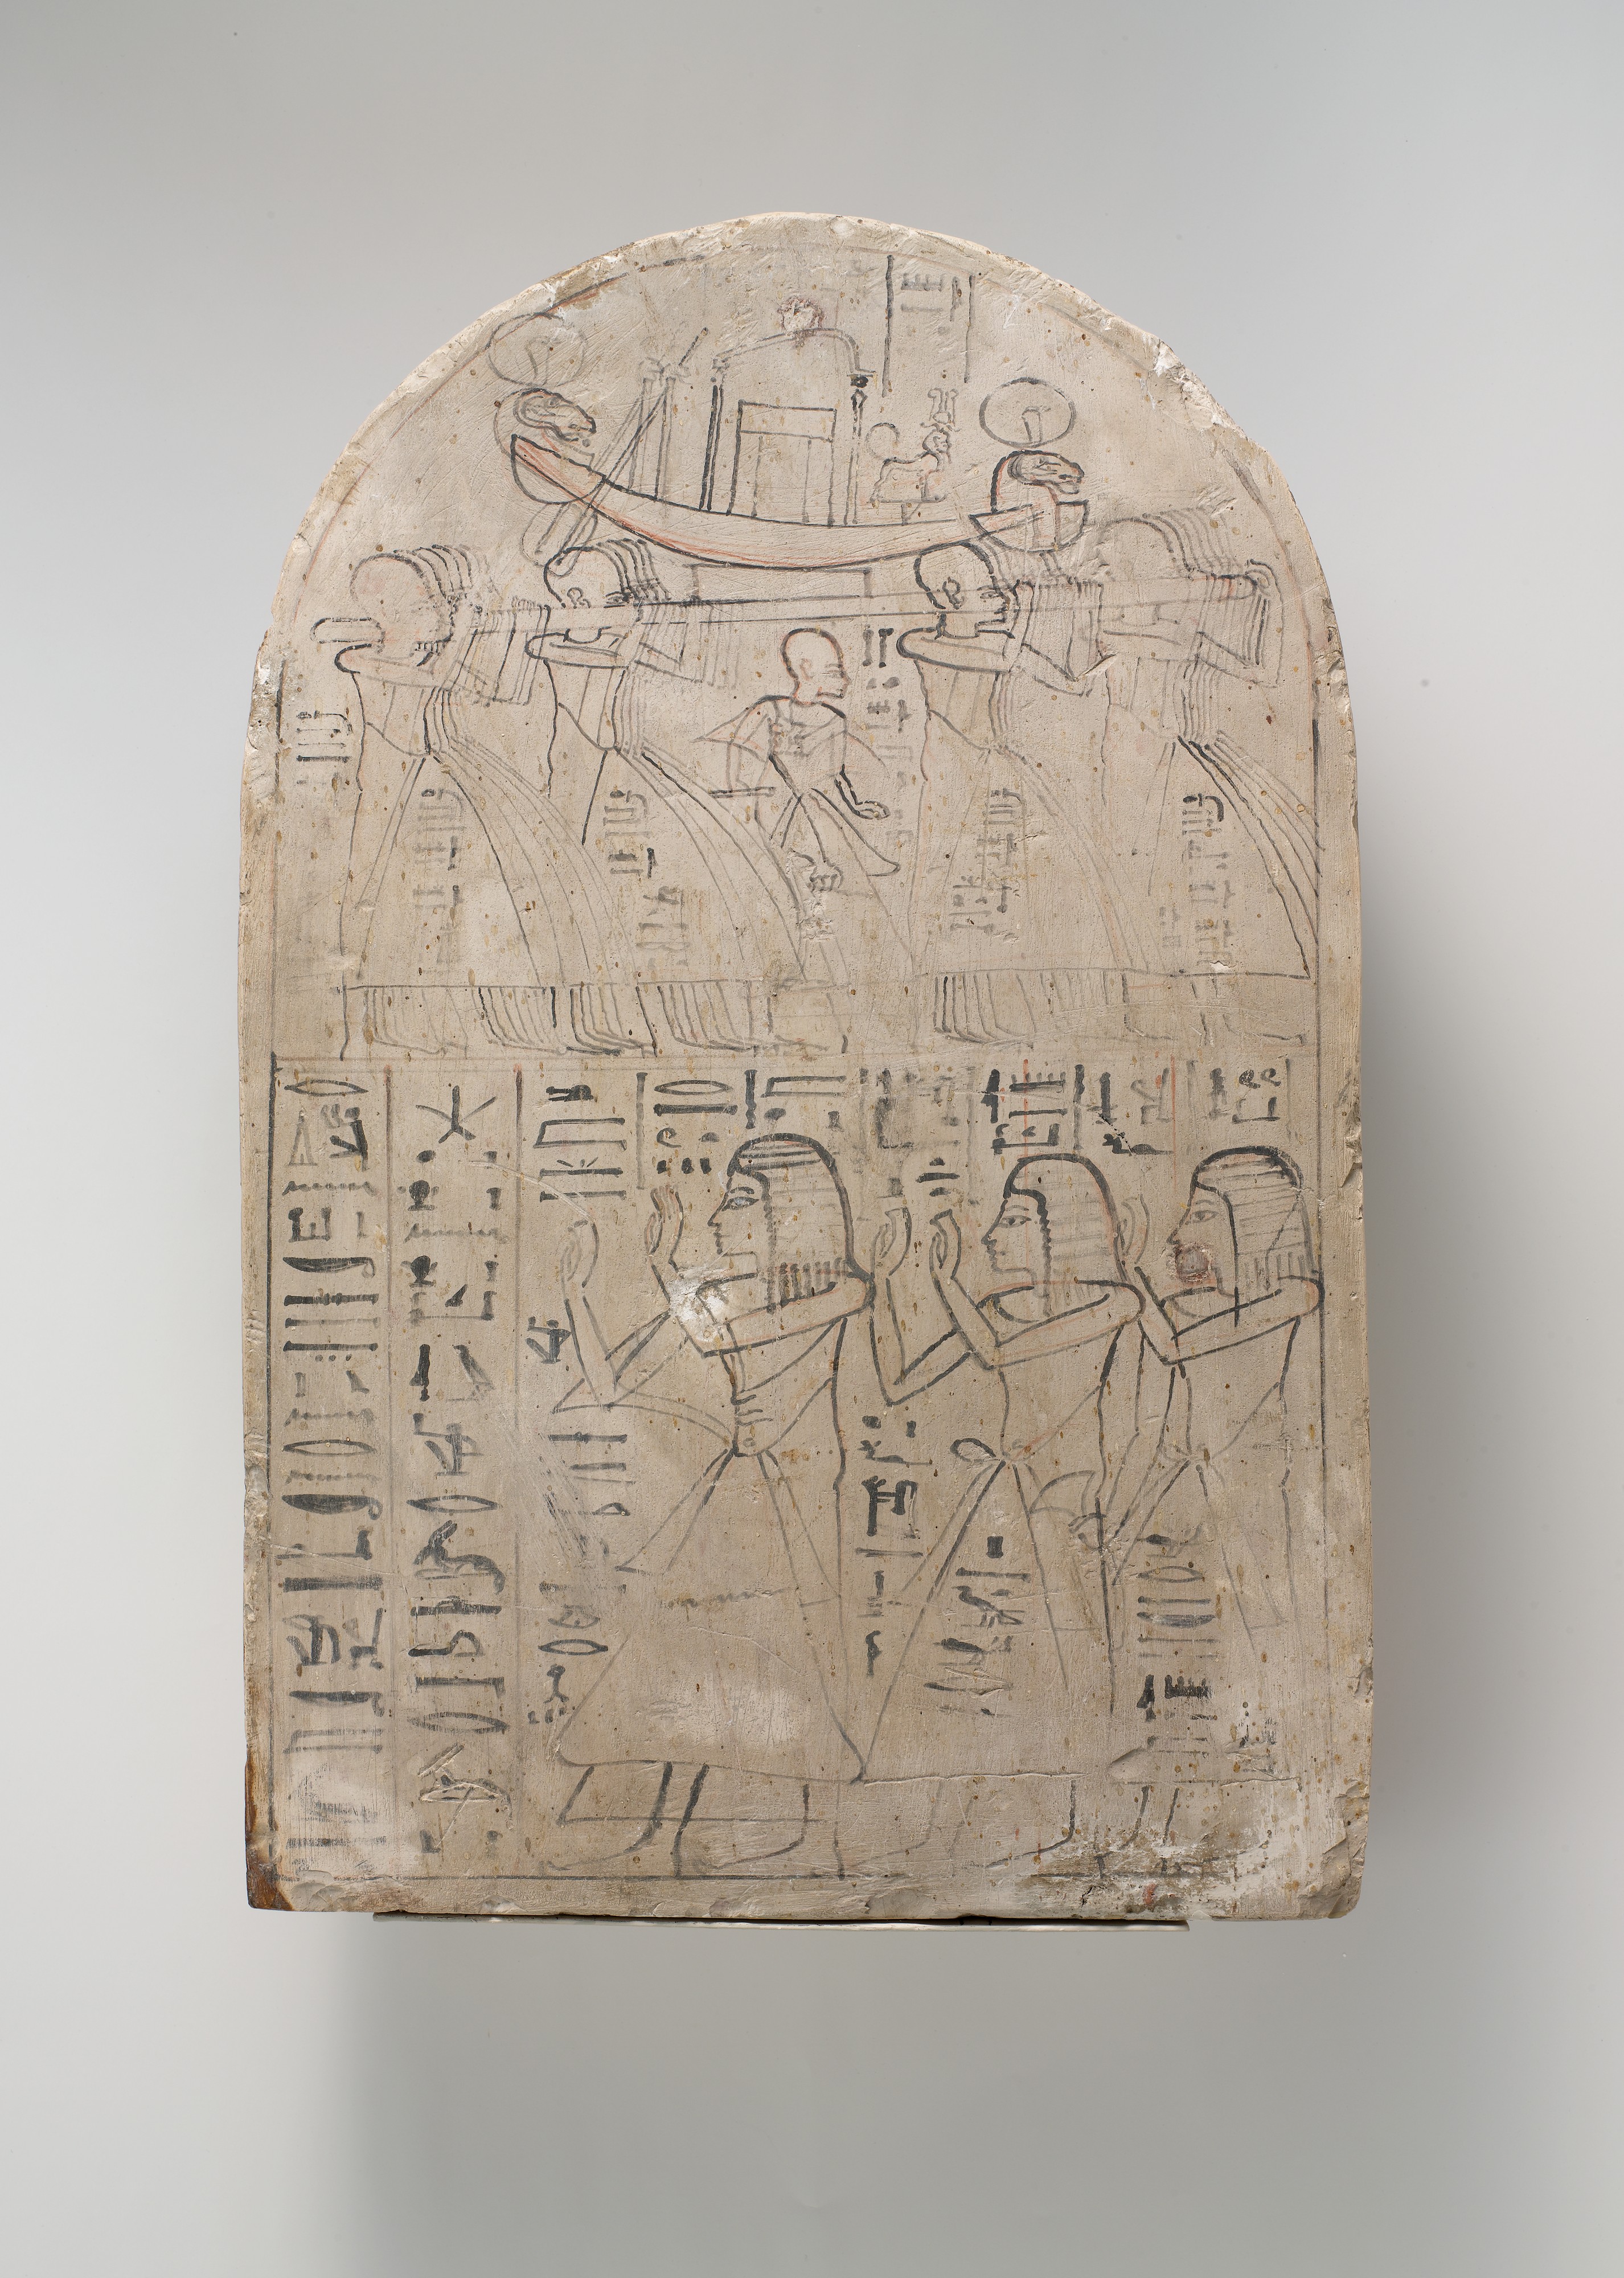
It began in the 12th century B.C., when Egyptian scribe Amennakhte drew the earliest surviving topographic map—a map which shows the shape of the land. It featured a winding line with large flat cones on either side—a valley bottom between hills. Maps would be similarly crude for the next three thousand years, with hills and mountains drawn as simple pictures, and approximately located at best.

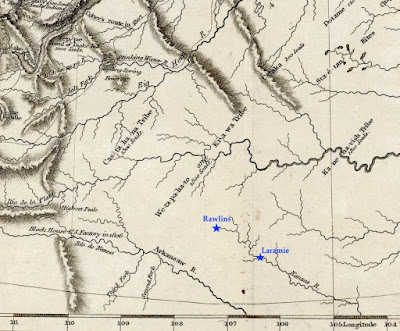
But by the early 1800s, techniques were  much improved. Maps by William Clark of the Lewis and Clark expedition, and Charles Preuss, John C. Frémont's cartographer, added significantly to our geological knowledge. But they weren't perfect. Clark put today's Colorado too far north, thereby eliminating the Laramie Plains. Preuss's map was accurate for major features, but finer details could be unreliable. And on both maps, mountains were shown using hachures—short parallel lines suggesting relief but with little specific information. The third dimension remained elusive.

Excerpt from Preuss's map, showing the Laramie Plains crossed by the mysterious Right Hand Fork of the Laramie River (state line added). David Rumsey Map Collection.

After a grim hiatus, mapping resumes

Through the 1850s, the Army Corps of Topographical Engineers continued to explore and map the American West. The emphasis was route-finding, exemplified by the Pacific Railroad Survey—four concurrent expeditions looking for a way across the Rocky Mountains. But mapping came to a halt with the start of the Civil War, except as needed by the Union Army.

About five years after the War's end, the government began to invest again in maps. They were badly needed, for while France and England were putting final touches on national maps, and a dozen more countries had surveys in progress, the United States lagged far behind.

In 1870, a young US Army Lieutenant, George Montague Wheeler, presented a detailed proposal to map the United States west of 100º longitude (which roughly bisects the Dakotas). In need of post-war work, the Corps of Topographic Engineers jumped at the opportunity, and in 1871, Wheeler launched his "Survey West of the One-Hundredth Meridian."

George Montague Wheeler ca. 1872; National Portrait Gallery (SI)

Where on Earth are we?

Just a year later, on November 30, 1872, James H. Hayford of the Laramie Daily Sentinel reported, "Some parties are putting up some aparatus [sic] and a temporary observatory near our office today, under the supervision of Lieut. Wheeler [it's unlikely Wheeler himself was present], for the purpose of taking some astronomical observations to determine the latitude and longitude of this place."

Wheeler's men, John H. Clark and F.R. Simonton, had already made astronomical observations at two other locations in Wyoming Territory: Fort Fred Steele and Cheyenne, where they came up with a handy improvement to standard procedure. "A large wall-tent drawn over a framework formed the observatory. ... it was found to be an improvement to retain the ridge-pole [during observations] as a support against the violent winds so prevalent."

All in all though, working conditions were luxurious compared to those of the Frémont expedition 30 years earlier. Clark and Simonton could partake in the conveniences offered by the Laramie City, just four years old. Furthermore, their tent "was furnished with all the appliances of a field and temporary observatory, such as stools, stands, tables, and the like, and nothing was wanting as to equipment for first-class field-work. The [local] telegraph company furnished the line."

Longitude by wire

However, one thing hadn't changed since Frémont's time—longitude remained the greater challenge. There was no way to measure it directly. Instead, it was calculated based on the difference in time of specific celestial events in Laramie, and in Salt Lake City where longitude had been determined in 1869. [If you are thinking Laramie and SLC are in the same time zone, you're correct. But for this procedure, the surveyors used local time, also called solar time.]

To determine time difference, Clark and Simonton relied on the near-instantaneous communication of telegraphy. Time was recorded by chronograph—a combination of chronometer (clock) and paper-covered cylinder. Powered by a small battery, the cylinder turned exactly once per minute, as a pen marked a chronometer tick every second. After each minute, the pen-holder advanced slightly. The result was a piece of paper covered in parallel lines of tick-marks, a printed record of time.

As the chronometer clicked and the cylinder turned, the men added astronomical observations to the chronograph record, in real time. One man kept an eye on the heavens while also recording meteorological conditions and other notes on a paper form. When a star to be tracked approached, he notified the Observer at the telescope. At the moment the star entered the telescope's field of view, the Observer tapped a key wired to the chronograph, thereby leaving a mark on the paper. He did the same when the star passed out of view.

Drum chronograph by William Bond & Son, ca. 1850; "an instrument that touched a pen to a paper-wrapped cylinder to record both the beats of the clock and the instant of a celestial event, signaled when an observer pressed a telegraph key." (courtesy National Museum of American History)

This was only half the project. Each time the Observer in Laramie pressed the key, the signal also was sent via telegraph to a chronograph in Salt Lake City, overseen by their coworker, E.P. Austin. From the two sets of long paper records, they determined that stars passed over Laramie 25 minutes and 12 seconds before passing over Salt Lake City, putting the Laramie observatory at approximately 105º 35' 24" longitude (only about four blocks too far east according to Google Earth, not bad for field data!).

Star-gazing in Laramie, Wyoming in December

Obviously, Clark and Simonton were able to determine longitude much more accurately than Frémont had three decades before. But the work was challenging even so. They had constructed a rigid base for their instruments, but thundering trains shook them out of adjustment, and the metal contracted and expanded with temperature. Ink froze on the coldest nights, and the men's concentration waxed and waned with weather and amount of sleep.

So for accuracy, multiple stars were observed on multiple nights—but only when skies were clear at both ends of the telegraph line. To get enough observations, Clark and Simonton spent most of December in Laramie, "subjected to too much cold and too many wind and dust storms for any human brain and muscle to effect its best work in astronomy," according to Clark.

The future arrives

Wheeler's 1877 Progress Map; published sheets are brown. Laramie is near the east edge of Sheet 43. David Rumsey Map Collection.

In just eight years, Wheeler's crews surveyed 333,000 square miles; 75 topographic atlas sheets were produced (but no Laramie Sheet). The tradition of representing relief using hachures continued, often with the addition of spot elevations (numbers). But there was a revolution afoot. During the same time, John Wesley Powell and Almon Harris Thompson, of the US Geographical and Geological Survey of Territories, were producing topographic maps using contour lines, which connected points of equal elevation. These maps showed the shape of the land in greater detail and more accurately.

Excerpt from Wheeler's hachured "Central Colorado Atlas Sheet # 62a" (1878). Click to view scattered spot elevations. David Rumsey Map Collection.
Excerpt from Powell and Thompson's contour map: "Green River from the Union Pacific Rail Road [WY] to White River [CO]" (1876); green marks irrigable land. David Rumsey Map Collection.

Mapping the Laramie Plains

In 1878, Wheeler's survey and three others were replaced with a single agency, the United States Geological Survey (USGS), tasked with "classification of the public lands, and examination of the geological structure, mineral resources, and products of the national domain." In 1882, its responsibilities were expanded to include preparation of a national map.

A decade later, on August 26, 1892, the Laramie Boomerang had great news. USGS surveyors Frank Tweedy and James McFarland had arrived and would "commence work upon the topography of this section of the country"—part of the national map of the United States already ten years underway. "This vast map will take at least 25 more years to complete [it would be more like a century] ... [and] when completed, would, if spread out, cover a little over 3/4 acre ..."

Obviously impractical, the great map had been divided into sheets, each named for a prominent local feature (for example, the Laramie Sheet). Vertical relief would be shown with contour lines, now recognized as far better than hachures, which cluttered maps, provided limited information, and were expensive to draw and print (almost as costly as fieldwork!).

No need to bother with longitude

The point established 20 years earlier, by Clark and Simonton of the Wheeler survey, did not go to waste. Tweedy and McFarland used it as the starting point for their survey. From it, they ran a baseline along the bed of the Union Pacific Railroad north of Laramie for 2.5 miles. The ties supported their tape nicely, and there was no brush to clear.

Their methods show how far accuracy had come. The tape was held at 20 lb. tension using a spring balance at one end. After every four lengths, they remeasured and calculated the average. The metal tape was precisely 300 ft long, but that was at 62º F. So they tried to work mainly on cloudy days or at night to minimize expansion and contraction. They also kept a record of air temperature, for later adjustment (0.02289456 inch per degree).

From the baseline, Tweedy and McFarland established points across the Laramie Plains through triangulation—measuring angles. No longitude determinations needed! And no trees obscured their view. They measured distance, direction and height of prominent features—mountain summits, ends of ridges, forks of creeks, and so forth. They also made detailed sketches of landscapes.

After several months, Tweedy boarded a train and transported the data and sketches to Washington DC, where he and others would turn them into a map.

Reading the lines

Six months later, in March of 1893, County Surveyor W.O. Owen  received preliminary sheets for review (Owen had mapped Albany County the decade before, using shading to show relief). According to the excited Boomerang reporter who saw them, "The contour lines are so explicit that almost every cañon and hill can be determined at a glance."

Well, maybe. For many people, contour maps were new and counterintuitive. So the USGS provided an explanation with each map to help users interpret the winding lines. "Each contour [line] passes through points which have the same altitude. One who follows a contour on the ground will go neither uphill nor downhill, but on a level ... a succession of these contour lines far apart on the map indicates a gentle slope; if close together, a steep slope; and if the contours run together in one line, as if each were vertically under the one above it, they indicate a cliff."
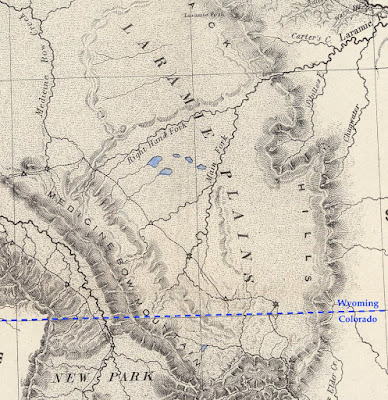
Excerpt from first Laramie Sheet (USGS 1895). Increasingly-close lines east of Laramie are foothills of the Laramie Range. Southeast of town, Red Buttes have dense lines on their steep sides, and none on the flat tops. Gentle terrain (lines far apart) stretches west for miles before meeting the dark steep face of Sheep Mountain.

Even the depressions of the Laramie Basin were mapped using contour lines. In fact, they are textbook examples—literally! They appeared as Plate 170B in "The Interpretation of Topographic Maps" (USGS 1908). "In many parts of the country are depressions or hollows with no outlets. The contours, of course, surround these, just as they surround hills. The small hollows known as sinks are usually indicated by hachures, or short dashes, on the inside of the curve."
Excerpt from "Plate 170B: Special types of lakes: part of Laramie Sheet" showing hollows or sinks of the Laramie Plains (USGS 1908).

Sources

These are some of the more interesting sources I found:

David Rumsey Map Collection (kinda like the Hotel California—hard to leave)


Evans, R.T., and Frye, H.M. 2009. History of the topographic branch (division): U.S. Geological Survey Circular 1341, 196 p. (PDF; unfortunately illustrations are missing)

For more about longitude determination, see the great Wikipedia article: History of longitude, especially "Land surveying and telegraphy". True enthusiasts will want to read "Longitude by Wire: Finding North America" by Richard Stachurski (2009).

Cohen, Paul. 2002. Mapping the West; America's Westward Movement 1524-1890. Hardcover. 65 fascinating maps and their stories (plus a very interesting account by David Rumsey of how he got hooked on maps).

This post is an expanded version of the second of two articles about mapping the Laramie Plains, my most recent contribution to the "Laramie History" column in the Laramie Boomerang.

Saturday, March 27, 2021

Mapping the Laramie Plains I: in pursuit of the 3rd dimension

"... almost every hill and cañon can be determined at a glance!" From first Laramie, Wyoming Sheet (USGS 1895; public domain).

In the spring of 1893, Albany County Surveyor W.O. Owen received a set of preliminary maps from the US Geological Survey for review. Owen had known what to expect, but the others who saw them were surprised. "The maps are of a very interesting character ...", wrote a reporter for the Laramie Boomerang, "almost every hill and cañon can be determined at a glance!"

Indeed, the new map was astonishing—mountains and depressions around Laramie had been clearly mapped using squiggly lines! But this achievement was long in coming. For millennia, mappers had struggled to show topographical relief, to capture the third dimension on a two-dimensional sheet of paper.

Line + cones = valley
From Amennakhte's map for pharaoh Ramesses IV. Public domain.
In 1160 B.C. Scribe-of-the-Tomb Amennakhte made a map for Egyptian pharaoh Ramesses IV, who was planning a trip to quarry sandstone suitable for statues. On papyrus, he drew a broad winding line with bumpy cones lying flat on either side. With a bit of imagination, we see this is a valley lined with hills.

Amennakhte's hills look terribly crude to our eyes. Yet they aren't all that different from those appearing on maps for the next two millennia. As late as the 16th century, during early exploration of North America, mountains were shown as oversized cones, though sometimes shaded to suggest depth. Often their locations were based on distant views from sea, or rumors.
Leftmost figure is "Royal Scribe of the Place of Truth" Amennakhte. Carving on limestone, ca. 1184–1070 BC. Metropolitan Museum of Art; public domain.

Lewis & Clark map new territory

The next centuries brought significant improvements in surveying and mapping, fortunately. In the early 1800s, the young United States was in desperate need of good maps. The Louisiana Purchase had doubled the country's size. Little was known about the new territory—not even its size, nor how to traverse it.

In May 1804, the Corps of Discovery Expedition, led by Meriwether Lewis and William Clark, headed up the Missouri River in search of a route to the Pacific Ocean. In preparation for the trip, Lewis was trained in celestial navigation. President Thomas Jefferson personally provided instructions for mapping:
"... you will take observations of latitude & longitude, at all remarkable points on the river [e.g., rapids, river mouths, islands]. The interesting points of the portage between the heads of the Missouri, & of the water offering the best communication with the Pacific ocean, should also be fixed by observation ..." [Jefferson assumed they could reach a west-flowing river by carrying their boats overland.] "Your observations are to be taken with great pains & accuracy, to be entered distinctly & intelligibly for others as well as yourself, to comprehend all the elements necessary, with the aid of the usual tables, to fix the latitude and longitude of the places ..."

Lewis and Clark faithfully executed Jefferson's instructions, for three years, four months, ten days and 8000 miles.

William Clark, explorer, soldier, Indian agent, territorial governor & cartographer; portrait by Charles Peale 1810. Public domain.
Clark's map reveals a multitude of mountains

William Clark took on the job of mapmaker. In addition to the Expedition observations, he used information from explorers, trappers, natives, and earlier maps to include areas not covered by the expedition. His first map showed the Corps’ route in great detail and was necessarily huge—50+ large sheets. He then produced a single map 52 inches long and 31 inches wide, engraved and published in 1814: “A Map of Lewis and Clark's Track, Across the Western Portion of North America ...”

Among the discoveries visible on Clark's map is the structure of the Rocky Mountains. They are not a single long ridge as previously thought, but a complex system of mountain ranges and foothills. In fact, after reaching the headwaters of the Missouri, the Corps of Discovery had to travel for weeks on horseback and foot to reach west-flowing waters. A portage across the Rockies was out of the question (click on image below).
Lewis & Clark's Track. Courtesy David Rumsey Map Collection (available in high resolution).
If you click on these images, you can see that mountains were drawn with hachures—short parallel lines looking something like eyelashes. Length and curvature gave a sense of height and steepness. Hachures were denser and darker on east and south slopes of ranges, suggesting a third dimension.

Clark's map was mostly accurate by the standards of the day. But there is a glaring error in the southern part. The Laramie Plains and surrounding mountains are missing! Little was known about the territory that would become southern Wyoming, so future Colorado and Kansas were moved north to fill the gap. This is why the Kanzas [sic] River was shown flowing where Rawlins and Laramie are today.

Today's southern Wyoming, from Lewis & Clark's Track. The Arkansas and Kansas Rivers were mapped hundreds of miles northeast of their true location, putting them in the vicinity of modern-day Rawlins and Laramie (added). Courtesy David Rumsey Map Collection.

The Pathfinder puts the Laramie Plains on the map

John C. Frémont "on the Rocky Mountains"; public domain.

In July 1843, a small contingent of the US Army Corps of Topographical Engineers climbed out of the canyon of the Cache-à-la-Poudre River, where they had hoped to find a route over the Rocky Mountains. Instead, they crossed the broad divide to the north.

In command was a young ambitious lieutenant—John Charles Frémont, the Pathfinder. This was the second of five expeditions he would lead through the American West, each time making significant contributions to geographical knowledge. He also would be court-martialed, lose a presidential election, squander large sums of money in mining schemes, and die in poverty. But all that was far in the future on that lovely summer day when the Laramie Plains came into view.

"The weather was pleasant and cool, we were disturbed by neither musquitoes [sic] nor flies; and the country was certainly extremely beautiful," Frémont would write in his report. "The slopes and broad ravines were absolutely covered with fields of flowers of the most exquisitely beautiful colors. ... As we emerged on a small tributary of the Laramie river, coming in sight of its principal stream, the flora became perfectly magnificent; and we congratulated ourselves, as we rode along our pleasant road, that we had substituted this for the uninteresting country between Laramie hills and the Sweet Water valley."

Challenges: stones, sagebrush, longitude

That evening, they camped on the Main Fork of the Laramie River, where Frémont took astronomical readings to determine latitude and longitude. While latitude seems to have been accurate, his calculation of longitude put them too far west, in the Medicine Bow Mountains near Lake Owen according to Google Earth. But that's not surprising. Estimating longitude was difficult, requiring careful tracking of stars with a precision telescope and a chronometer that kept steady time, or at least lost time at a steady rate.

For three days the party traveled northwest along the Medicine Bow mountain [sic]. The going was easy at first, but near the mountain they were slowed by large round stones in the soil. Equally difficult were ridges "made extremely rough by the stiff tough bushes of artemisia tridentata, in this country commonly called sage" [as it is today].

On August 2, they camped on the Medicine Bow River near "an isolated mountain called the Medicine Butte [Elk Mountain], which appeared to be about 1,800 feet above the plain, from which it rises abruptly, and was still white nearly to its base with a great quantity of snow". Frémont made more astronomical observations, this time including "an immersion [eclipse] of the first satellite of Jupiter." Even so, the calculated longitude again put them too far west.

After passing south of Elk Mountain, the party dropped down to the North Platte River, followed it to the Sweetwater, and continued on to California and Oregon. They would return home in August 1844, after about 15 months and 10,000 miles of travel.

A "meagre and skeleton" but valuable map (Frémont & Preuss 1845). High resolution version here, courtesy David Rumsey Map Collection. 

Dramatic report, spectacular map

Frémont wrote a colorful report about his adventures, with the help of his wife, Jesse, whose father—the powerful Senator Thomas Hart Benton—had secured funding for the expedition. Ten thousand copies were published the following year, to rave reviews. Included was the spectacular “Map Of An Exploring Expedition To The Rocky Mountains” measuring 52 x 30 inches, and stretching from the Missouri River west to the Pacific Ocean and from Los Angeles north to Mt. St. Helens.

However, much of the map was blank—to Frémont's credit. In a Notice to the Reader, he explained: "The map may have a meagre and skeleton appearance to the general eye, but is expected to be more valuable to science on that account, being wholly founded upon positive data and actual operations in the field." Indeed, the map is now considered a milestone, having set a new standard of cartographic accuracy for the American West.

The mapmaker was Charles Preuss, a trained surveyor and topographic artist from Prussia. He would accompany Frémont on three expeditions, making "continuous topographical sketches of the regions through which we passed, and which were never interrupted by any extremity of fatigue or privation" (Frémont's words). The large beautiful maps secured his reputation as a great cartographer.

Cartographer Charles Preuss, date unknown. Source (without attribution).

Laramie Plains up close

In the 30 years since publication of the Lewis and Clark map, techniques for representing relief hadn't changed all that much. Preuss also drew mountains using hachures, though in much greater detail. In the excerpt below (click to view), small narrow drainages are visible on mountains slopes, and low ridges and buttes dot the plains. Preuss varied hachures to show height and steepness. Lower ridges were drawn with shorter lines. Denser darker hachures indicated steeper slopes—for example Laramie Peak (top center of map) and, a short distance southeast, the canyon where the Laramie River crosses the Black Hills (now the Laramie Mountains).

From the 1845 map by Frémont and Preuss. Stars mark points where longitude and latitude were determined. At triangles, they measured the sun's height at noon to estimate latitude.

However, if we continue our examination, we're soon confused. Is that low mountain range paralleling the Medicine Bows Jelm and Sheep Mountains? Doesn't look right. Nor does the ridge east of the Main Fork. Most puzzling is the “Right Hand Fork” which (supposedly) joins the Main Fork of the Laramie River before it enters the canyon. Our history buffs still haven't solved this mystery.

Errors at this scale aren't surprising. With the great expanse of unknown territory ahead, there was little time for finer details, and though Preuss' map was highly accurate in its time, it's a far cry from the "very interesting map” showing every hill and canyon, which would so excite a Boomerang reporter 50 years later ...

[More to come in Part II.]

This post is based on the first of two articles about mapping the Laramie Plains, my most recent contribution to the "Laramie History" column in the Laramie Boomerang.